See Exactly Where Budgets Go Off Track
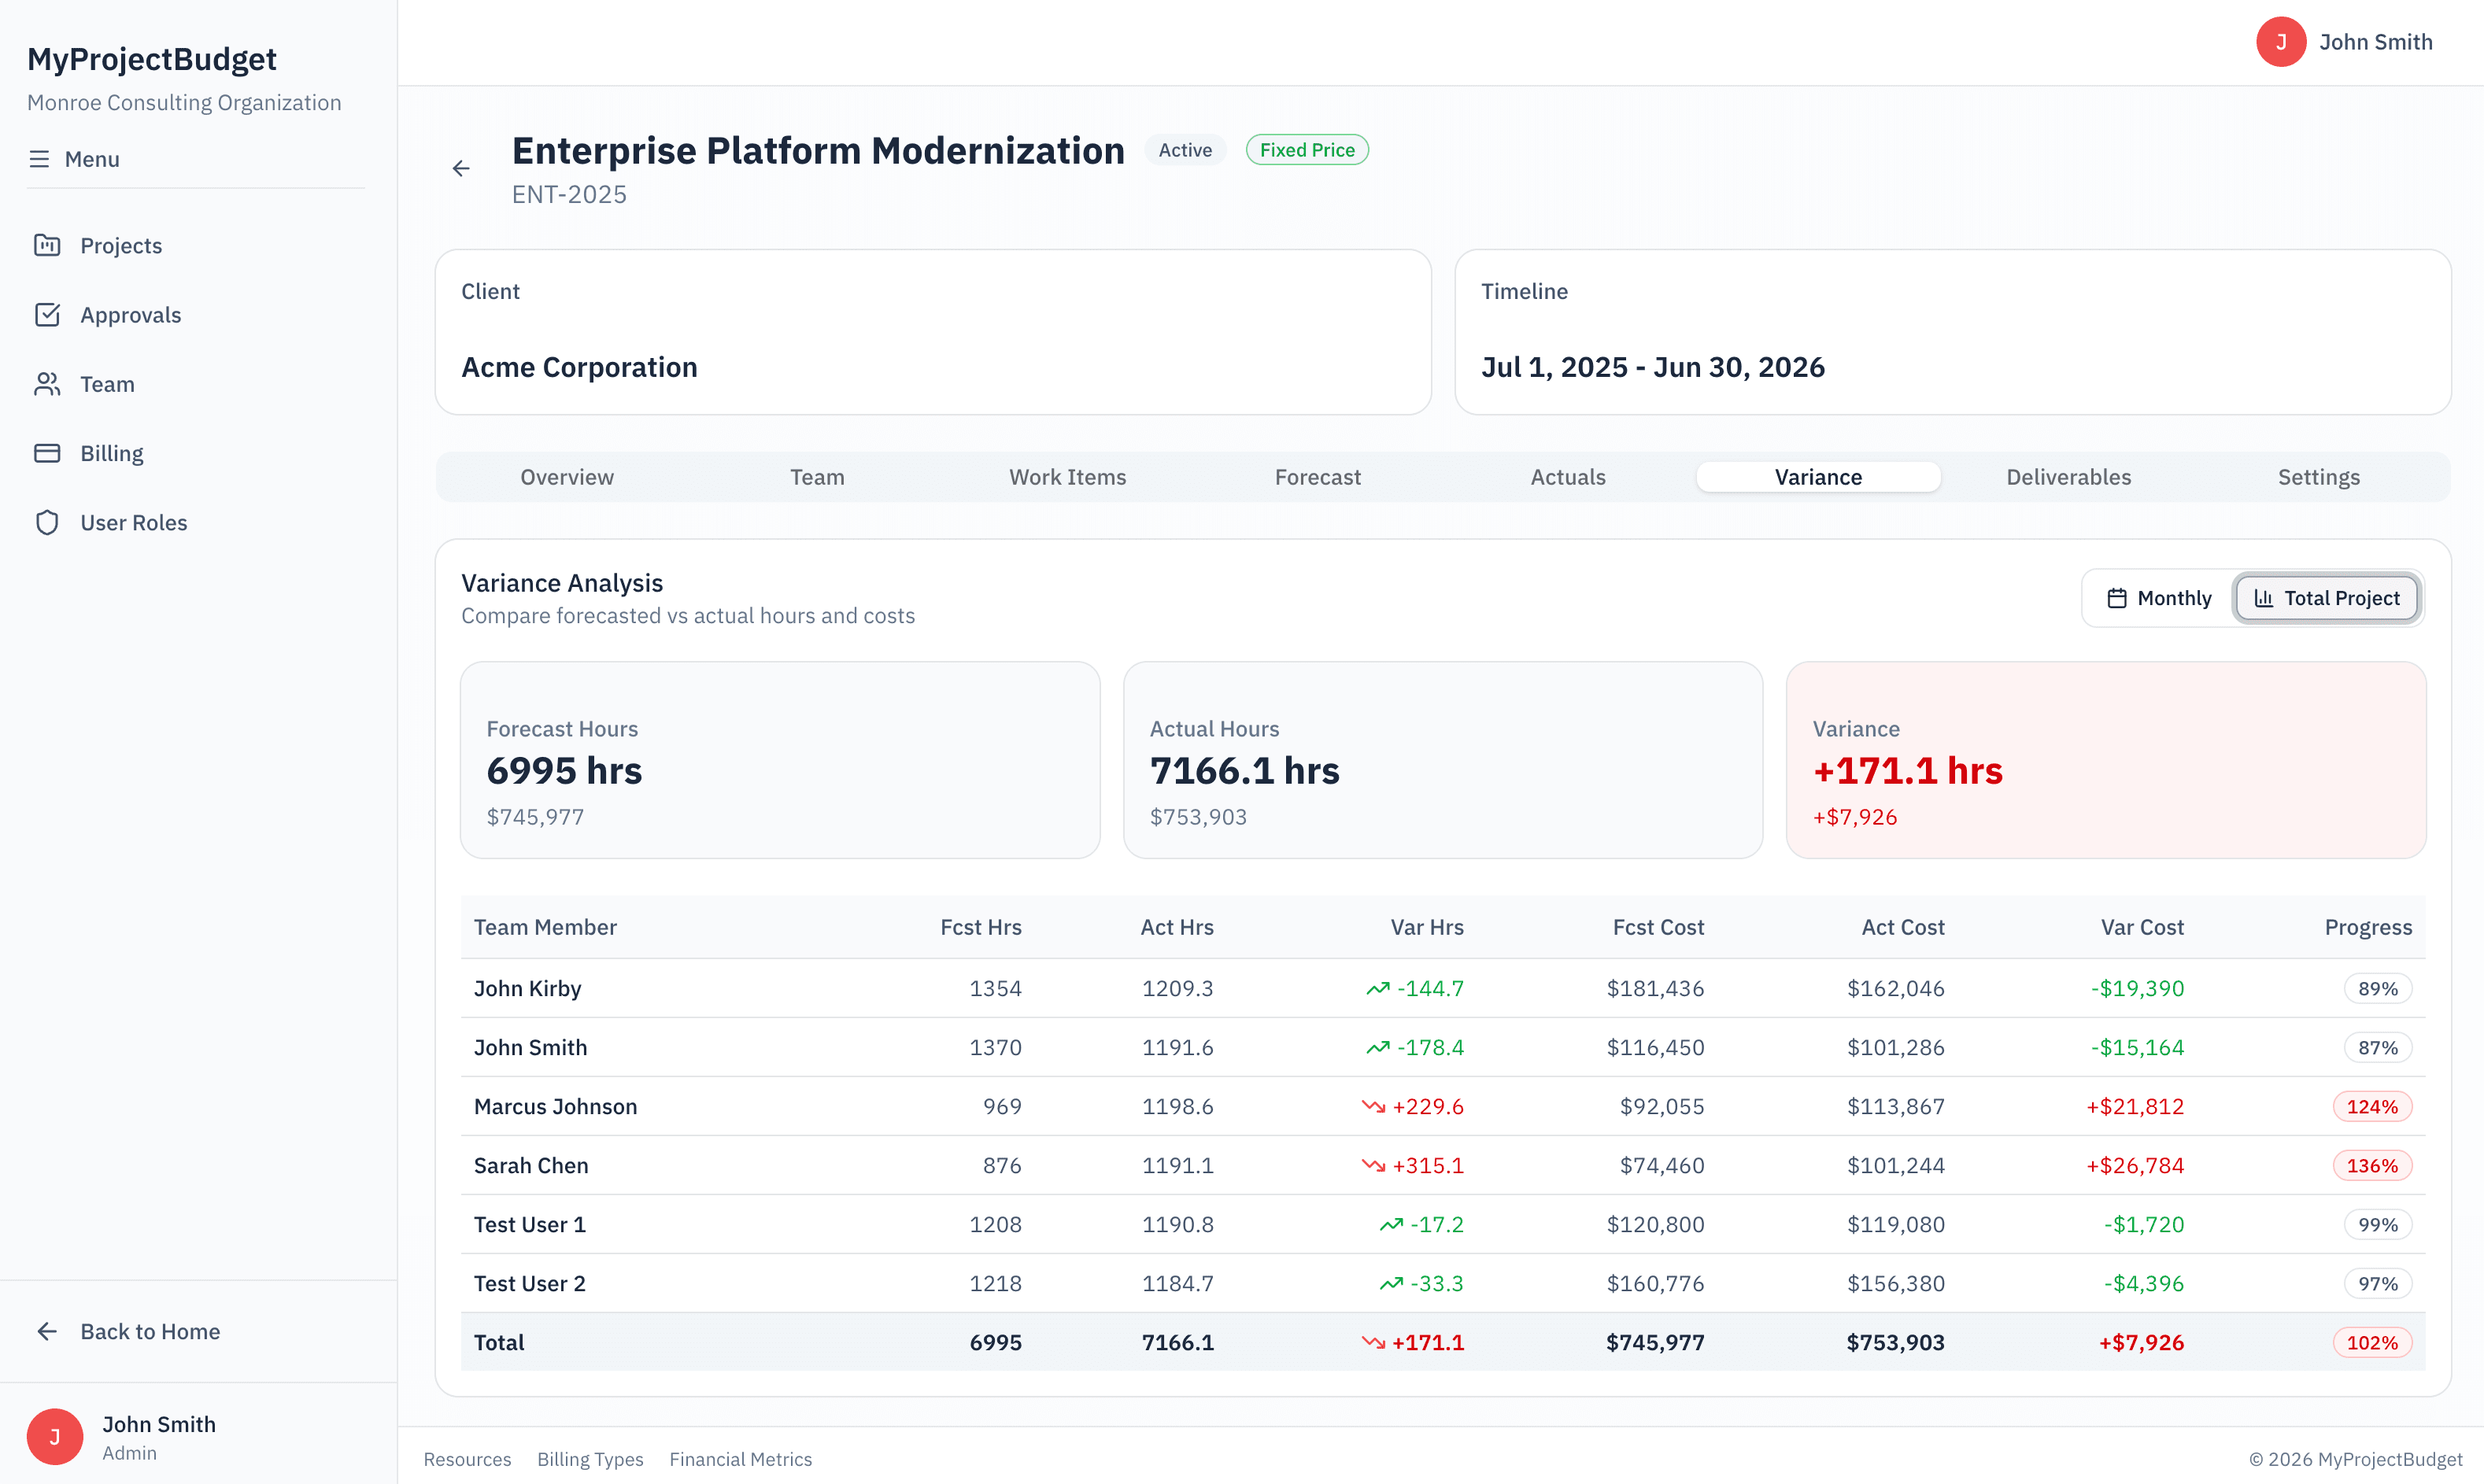
Drill into variance by team member. See hours and cost differences between forecast and actual. Understand not just that you're over budget, but why and where.
400h
Forecast
403h
Actual
+3h
Variance
Key Capabilities
Team Member Breakdown
See exactly which team members are over or under their forecasted hours.
Hours & Cost Variance
View variance in both hours and dollars to understand the full financial impact.
Trend Identification
Spot patterns across periods to improve future forecasting accuracy.
Root Cause Analysis
Drill into specific time entries to understand what drove the variance.
See It In Action
Variance report showing team member breakdown with hours and cost differences
When to Use Variance Analysis
PM review meetings
Walk through variance reports with the team to understand what drove over or under-performance.
Corrective action planning
Identify which team members need scope adjustments or additional support.
Post-project analysis
Review final variance to improve estimation accuracy on future engagements.
Related Features
Budget vs. Actual
Track every dollar against your plan.
Forecast the Future
Compare planned vs actual at any point.
Real-Time Profitability
See margins across your portfolio as hours are logged.